背景
监控服务器状态是运维必不可少的一部分,这里给大家介绍的是一种监控系统grafana,grafana仅仅只是提供界面显示, 所以他需要从influxdb中获取数据, 而influxdb中的数据又需要从其他地方收集过来, 常用的收集工具是collectd和telegraf, 其中collectd这里不做介绍, 有些数据不是太适合, 而 influxdb 自身集成 telegraf插件, 不需要进行专门的配置
流程
collectd/telegraf(收集数据) ——-> influxdb(保存数据) ——-> grafana(显示数据)
安装配置
grafana 3.x+
1 | cd /opt |
默认启动端口 3000, 账户密码默认都是 admin
influxdb 1.x+
1 | cd /opt |
管理后台默认端口: 8083, 我们可以直接访问后台管理数据
数据传递默认端口: 8086, 其他服务传递数据的端口
telegraf 1.x+
1 | cd /opt |
grafana 使用
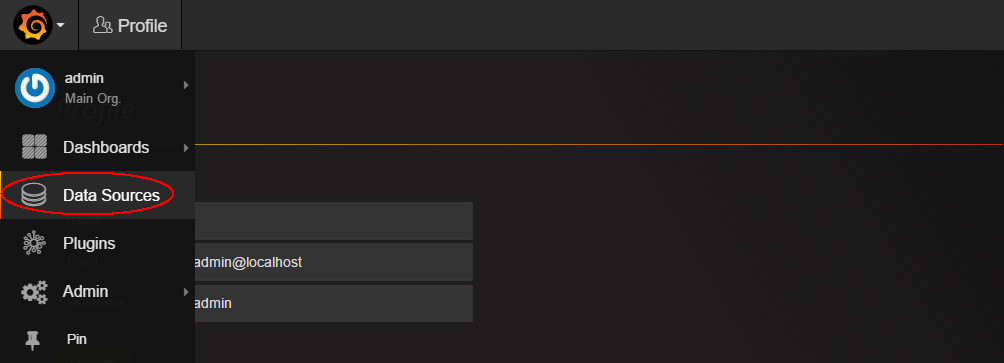
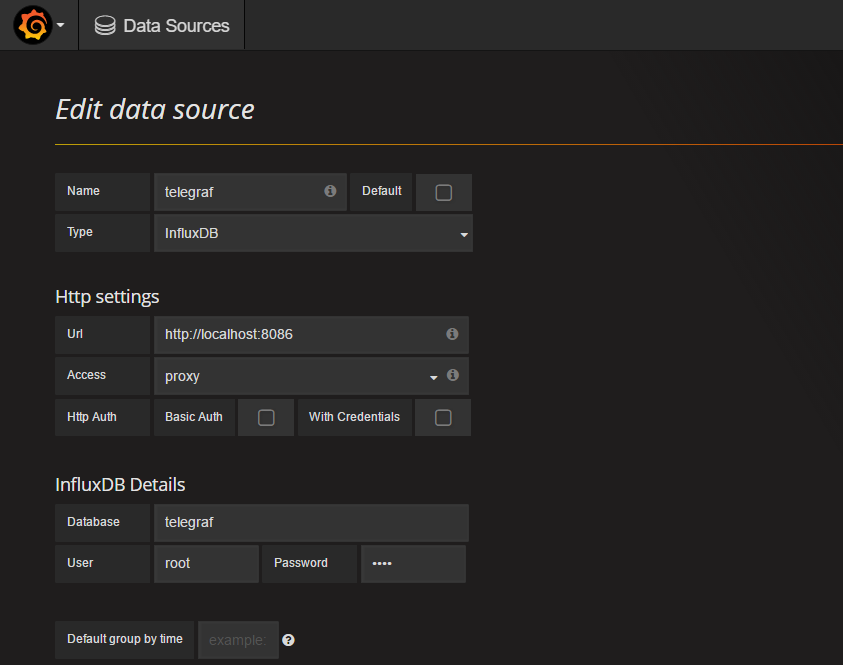
- 创建数据源
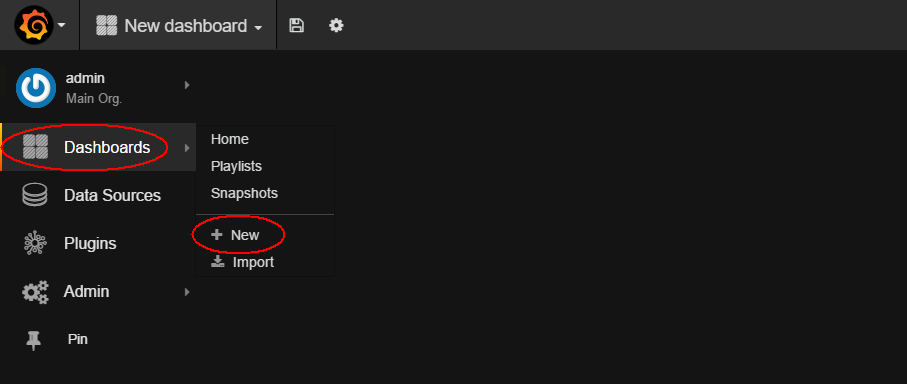
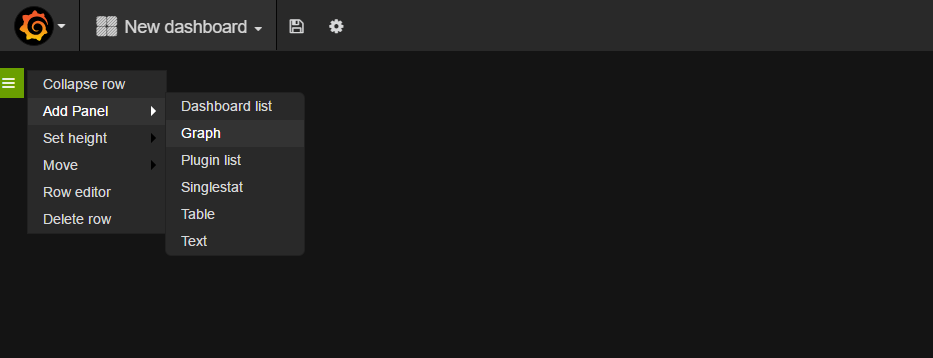
- 创建显示面板
- 添加单个面板
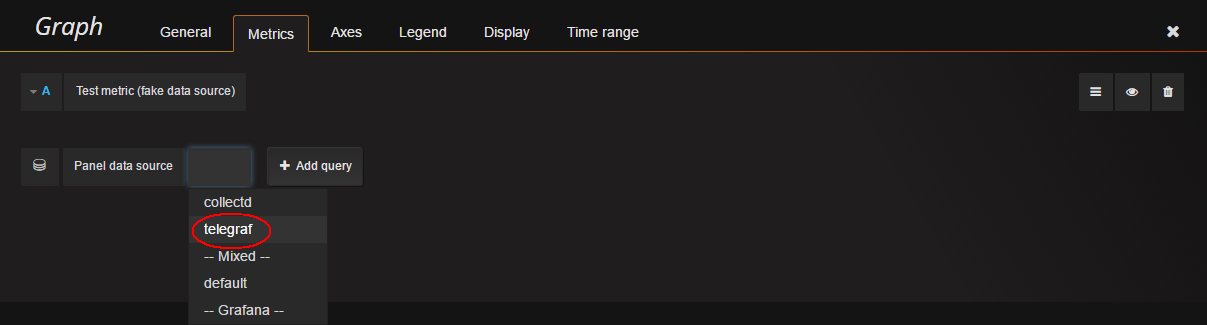
- 选择定义数据源
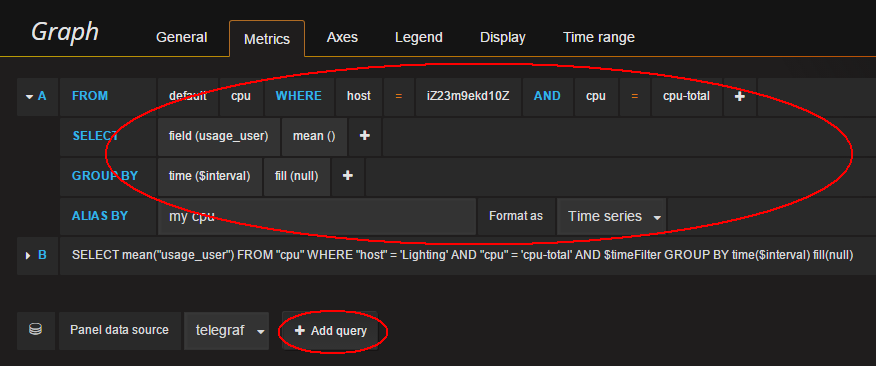
- 从数据源中添加数据
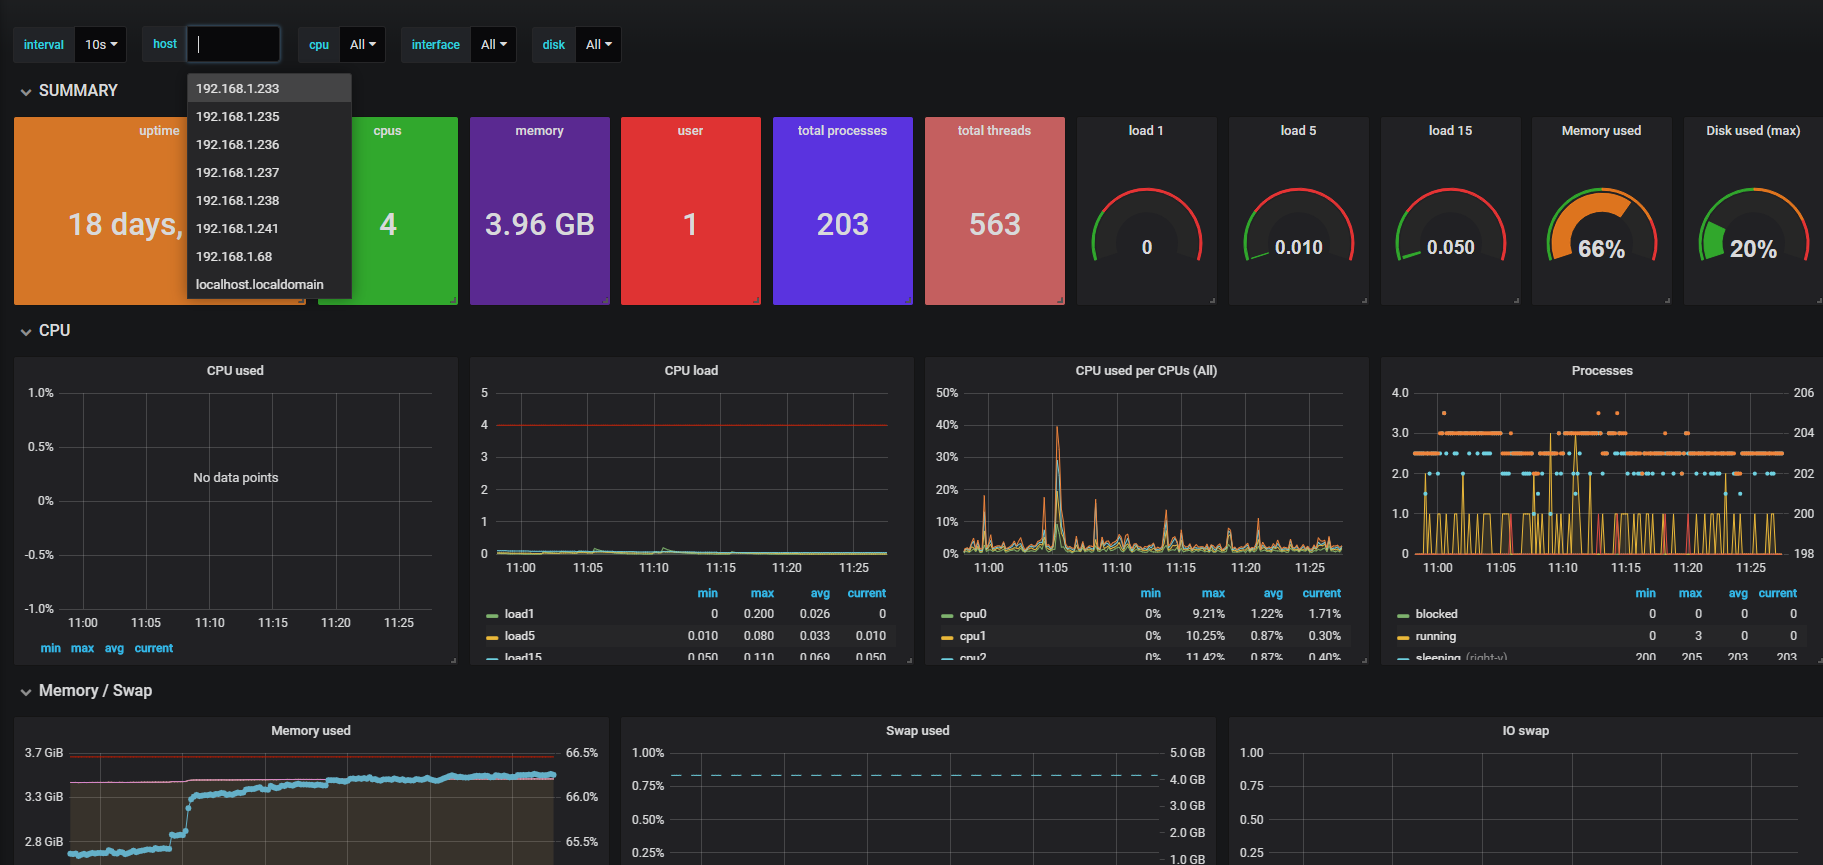
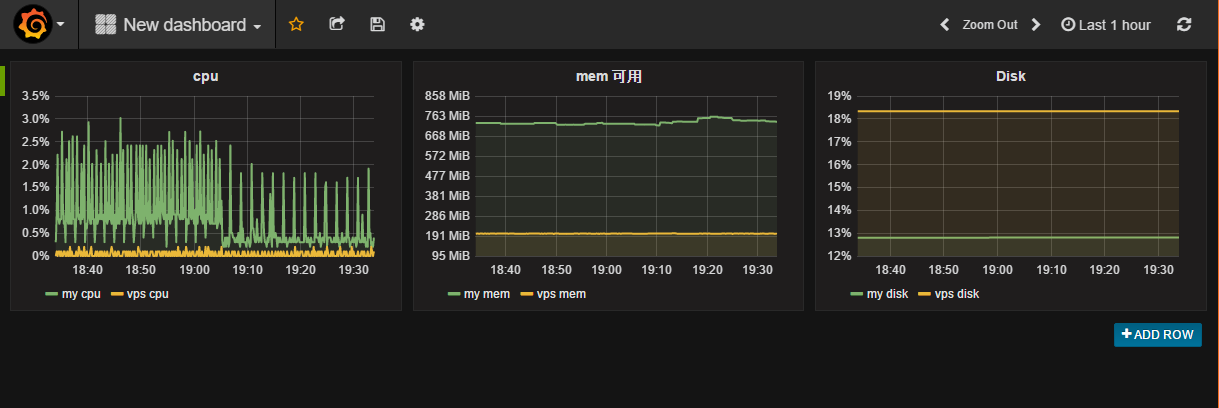
- 最终显示结果:
模板例子
在grafana官网上有许多模板
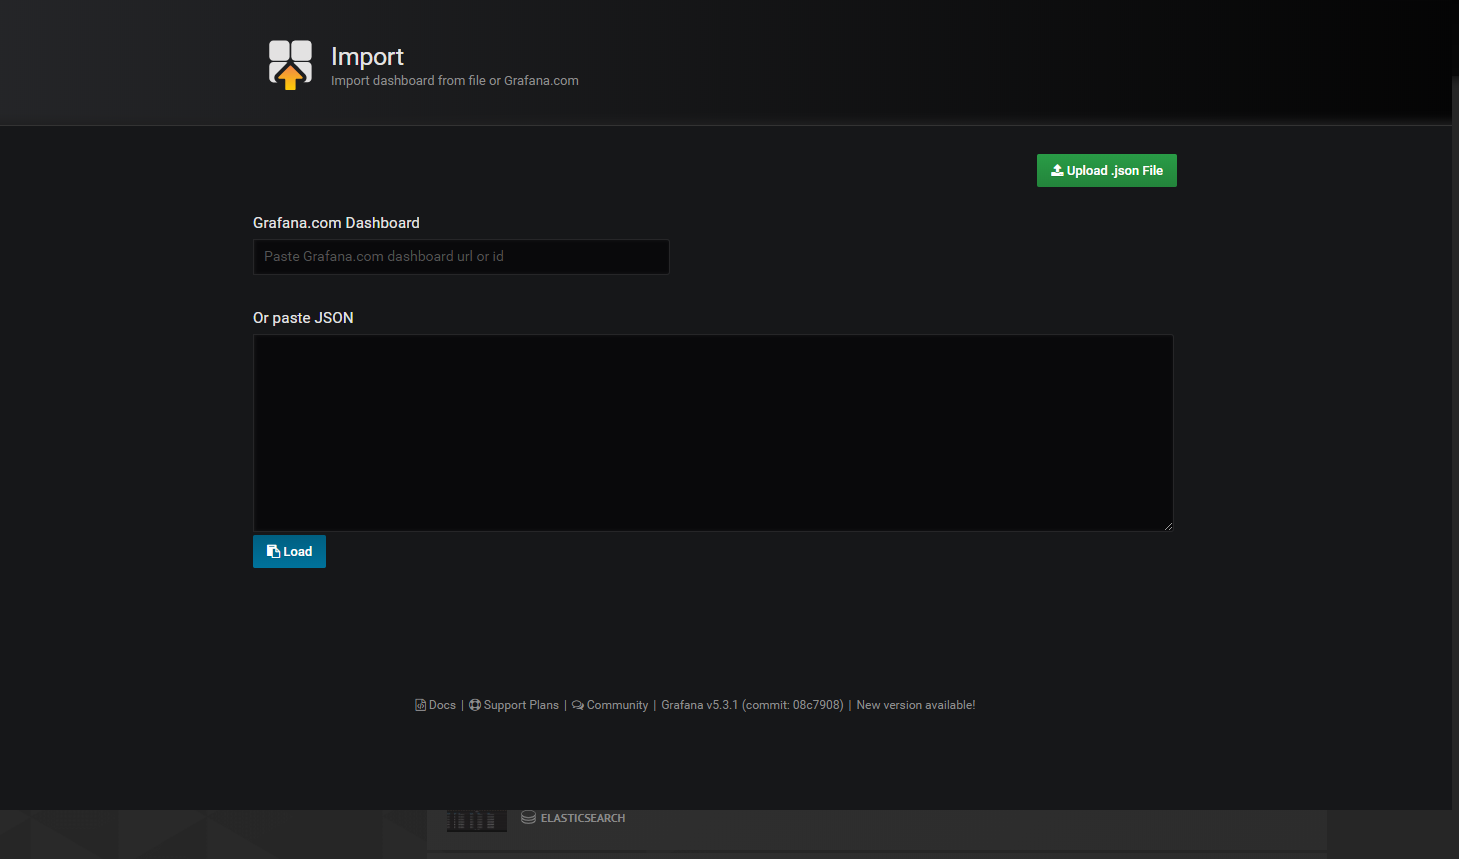
监控服务器模板链接
http://blog.lutao1726.top/system_rev4.json
效果图