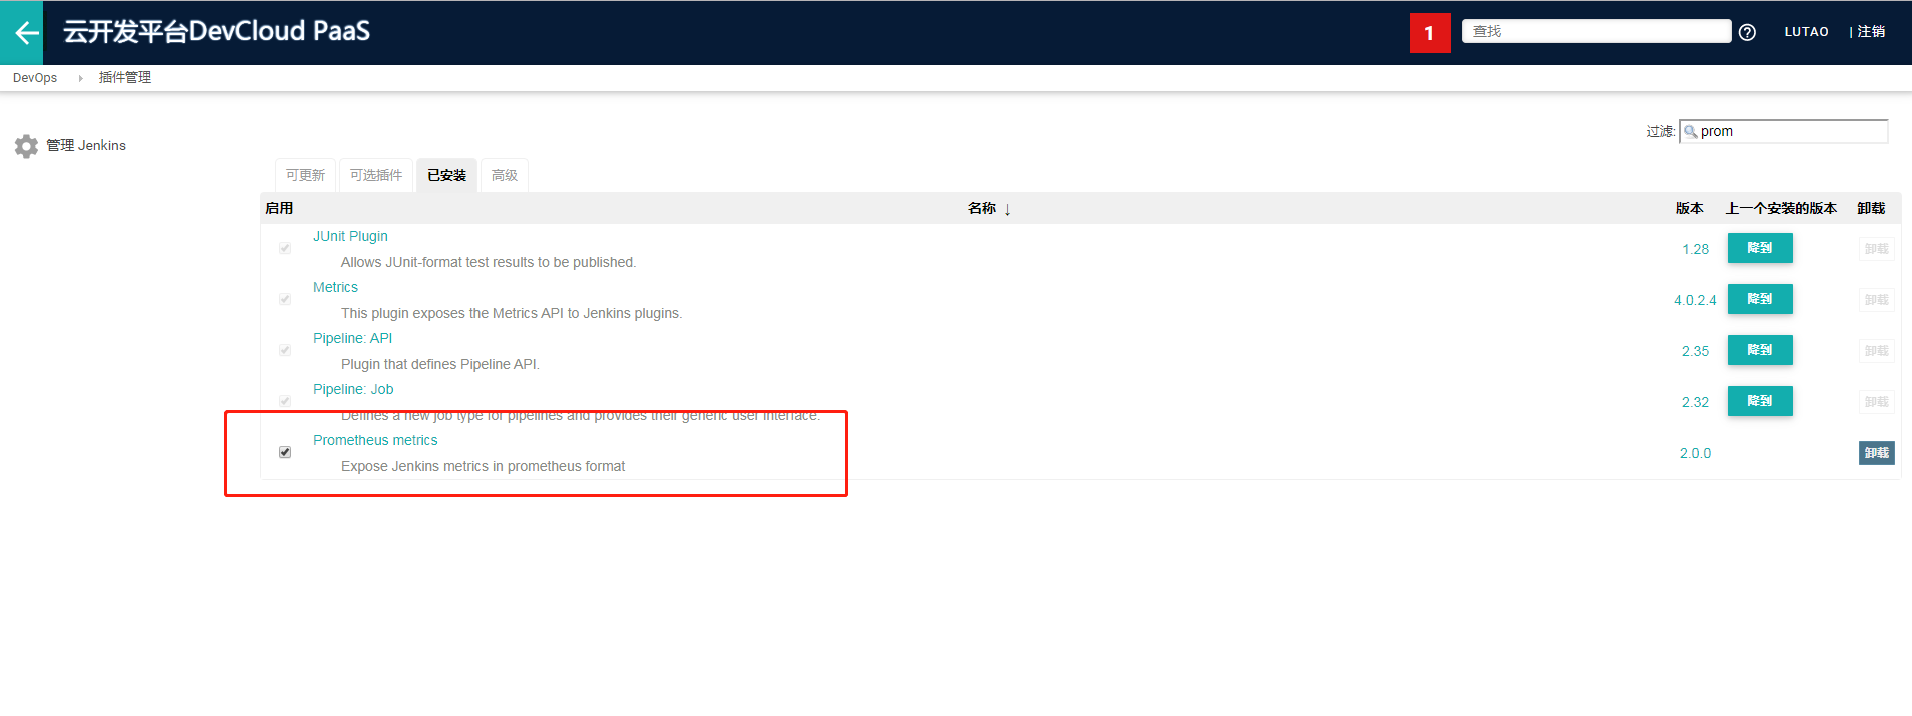
在jenkins中下载prometheus-plugin
修改prometheus配置文件
1 | - job_name: 'jenkins' |
重启prometheus
1 | nohup ./prometheus --config.file=./prometheus.yml & |
grafana配置
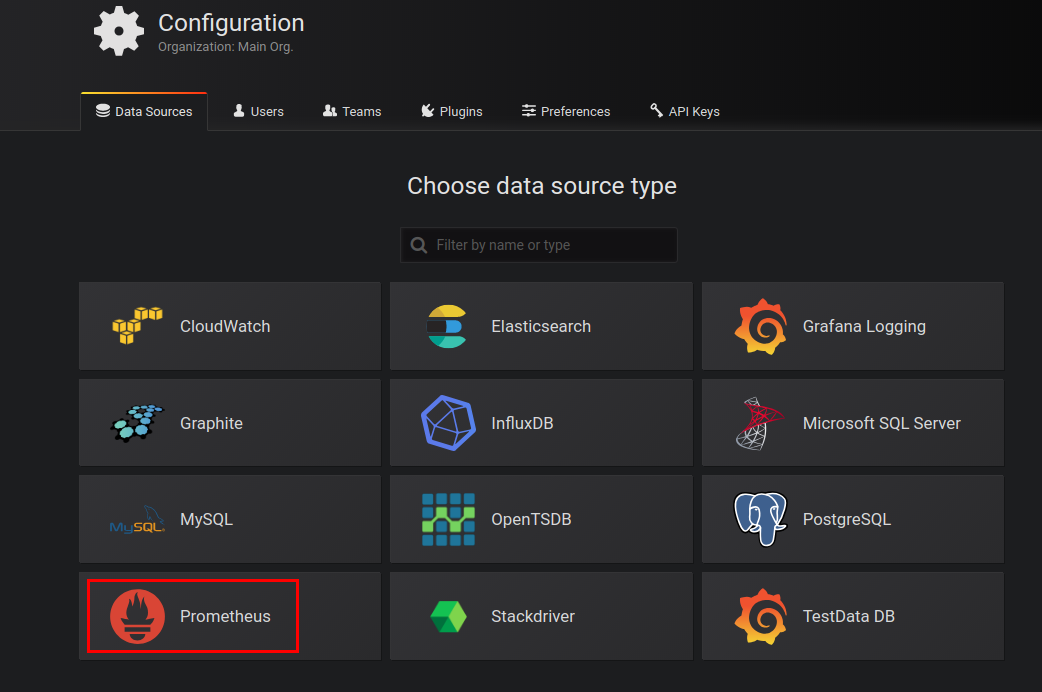
配置prometheus数据源
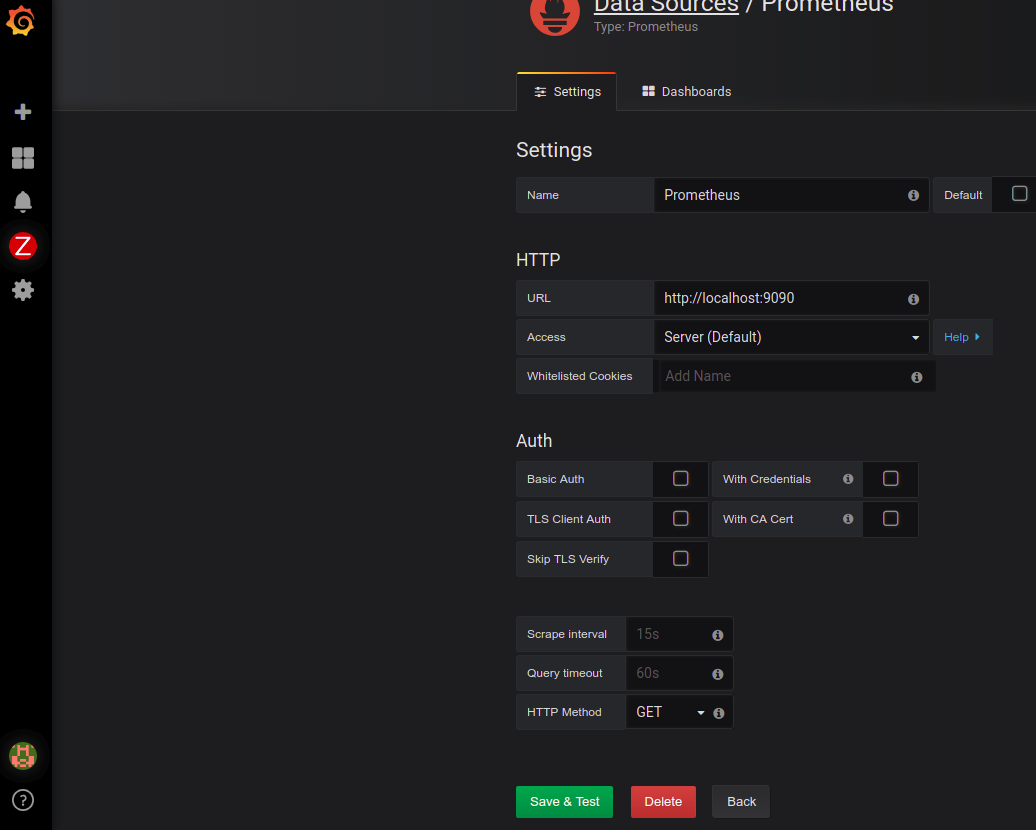
添加prometheus插件,然后配置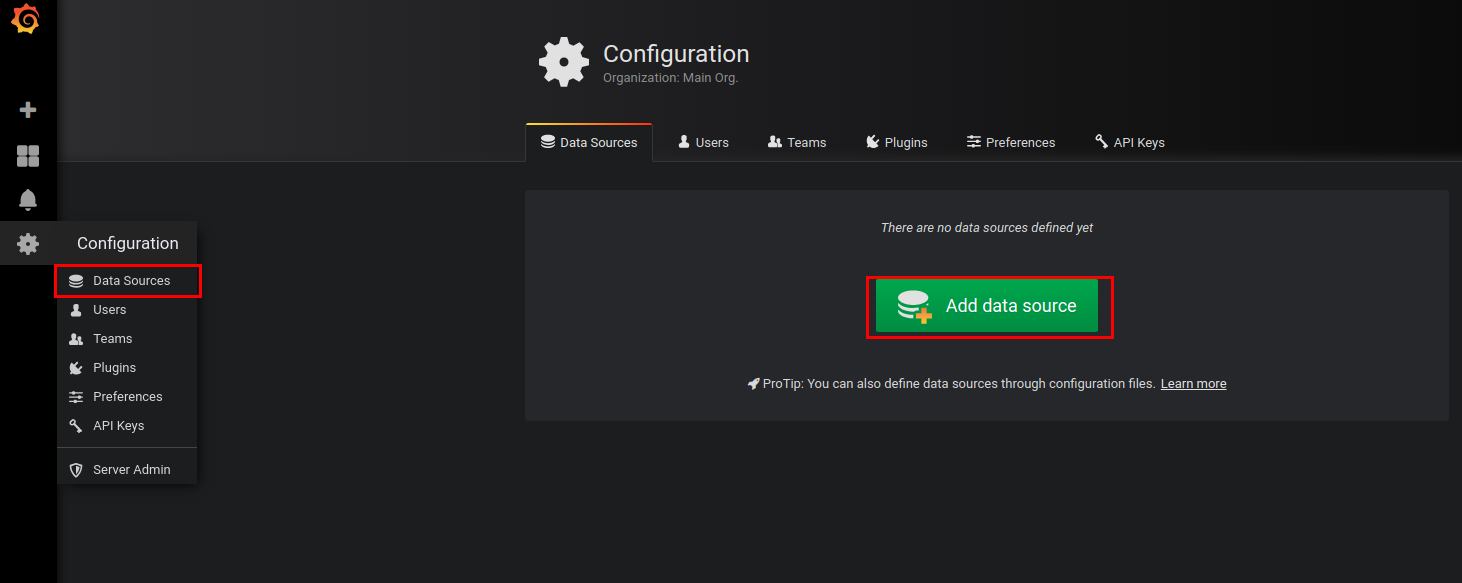
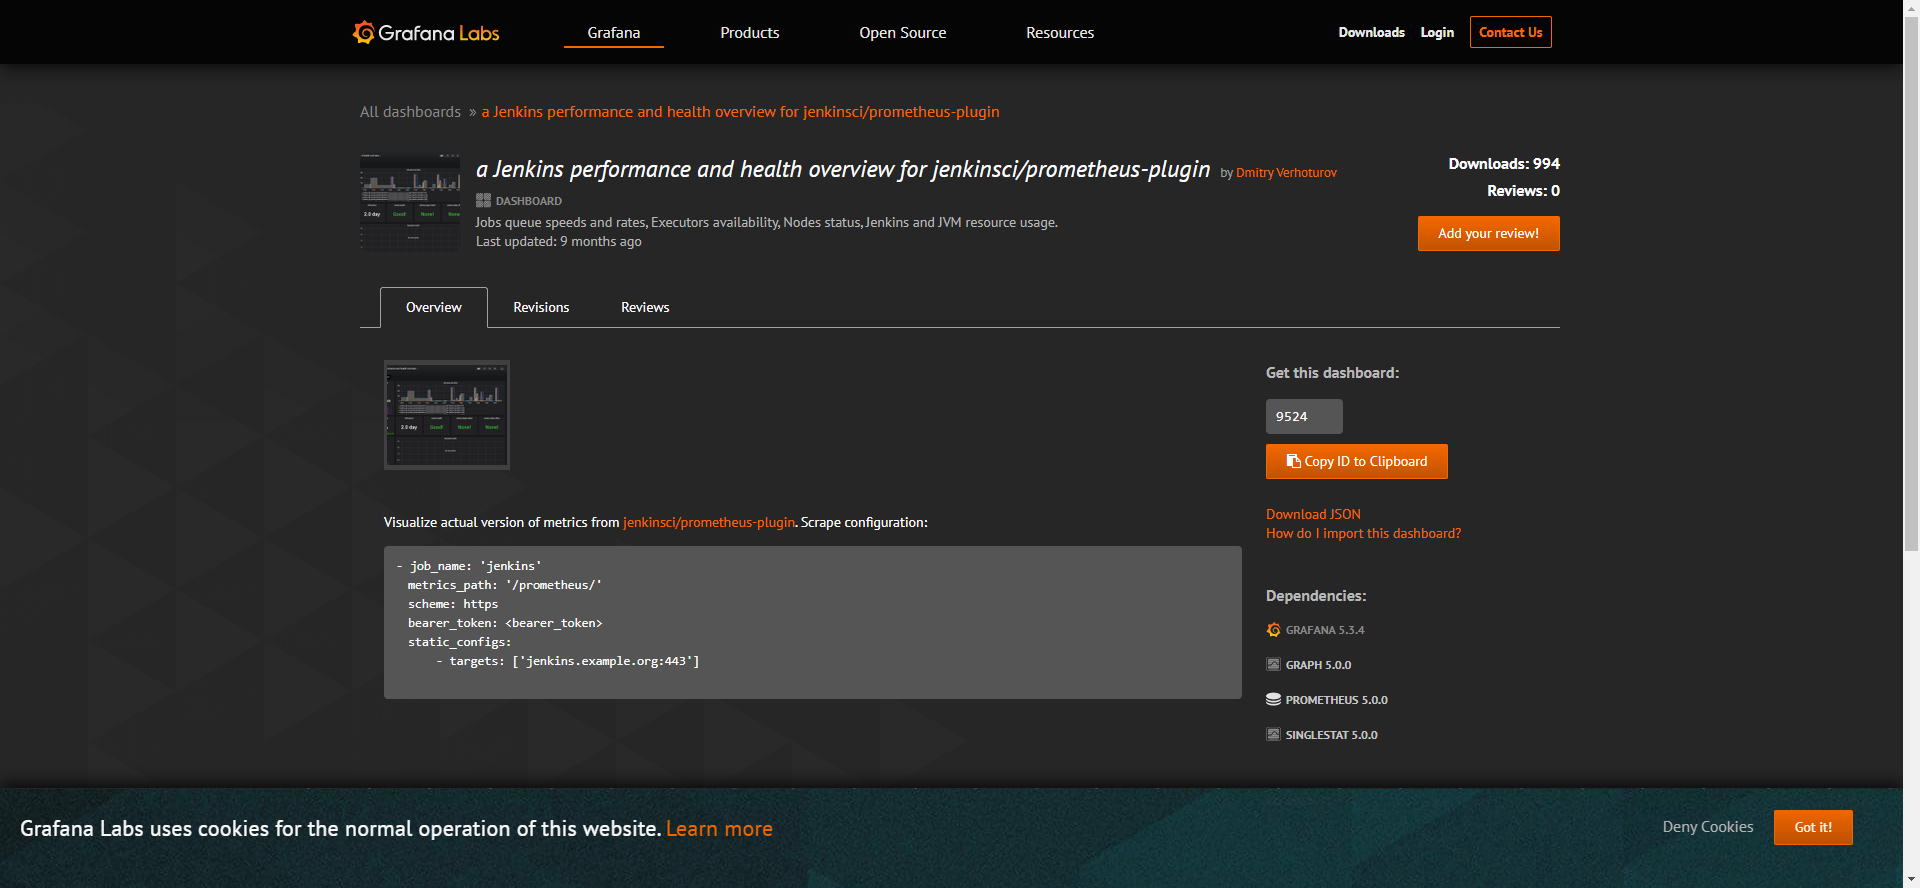
下载node_exporter仪表盘模板
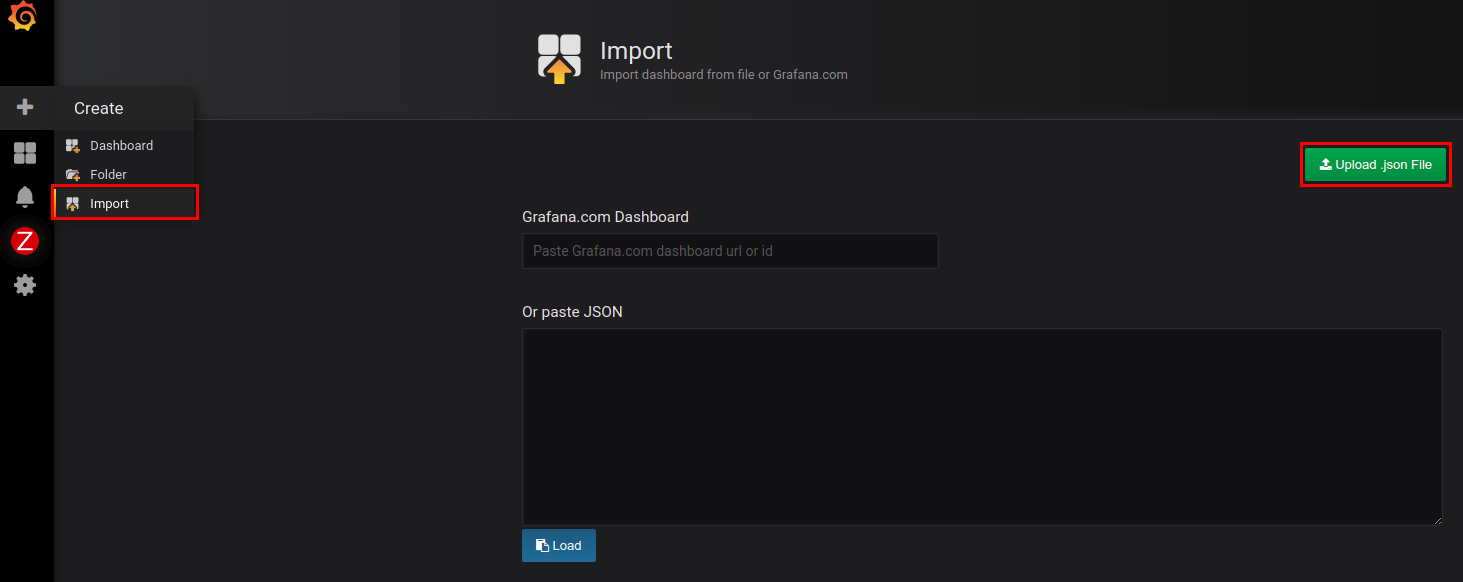
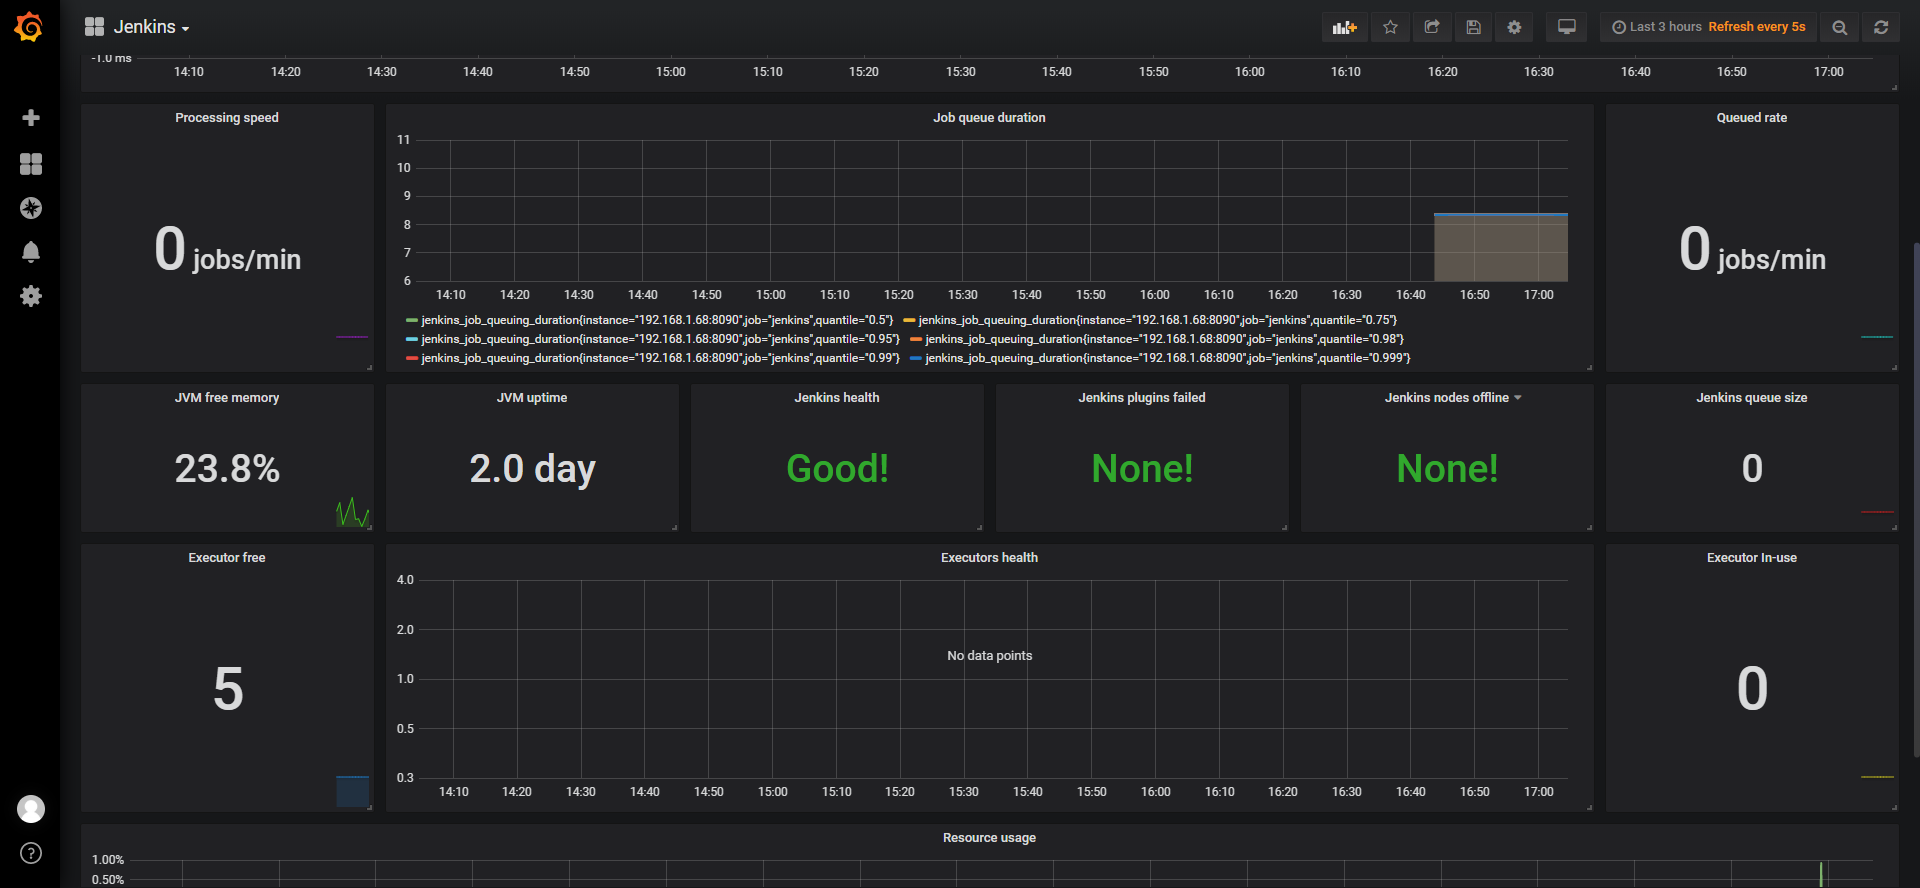
导入模板
1 | - job_name: 'jenkins' |
1 | nohup ./prometheus --config.file=./prometheus.yml & |
配置prometheus数据源
添加prometheus插件,然后配置