下载mysqld_exporter插件
在被监控端mysql服务器上创建账号用于mysql exporter收集使用
1 | GRANT REPLICATION CLIENT, PROCESS ON *.* to 'exporter'@'%' identified by '123456'; |
1 | wget https://github.com/prometheus/mysqld_exporter/releases/download/v0.12.1/mysqld_exporter-0.12.1.linux-amd64.tar.gz |
解压
1 | tar xf tar -xvf mysqld_exporter-*.tar.gz -C /app/runtime/prometheus |
配置文件 .my.cnf
1 | [client] |
在启动
1 | ./mysqld_exporter -config.my-cnf=".my.cnf" & |
查看node_exporter是否开启
1 | netstat -lntp |
修改prometheus配置文件
1 | - job_name: mysql |
重启prometheus
1 | nohup ./prometheus --config.file=./prometheus.yml & |
grafana配置
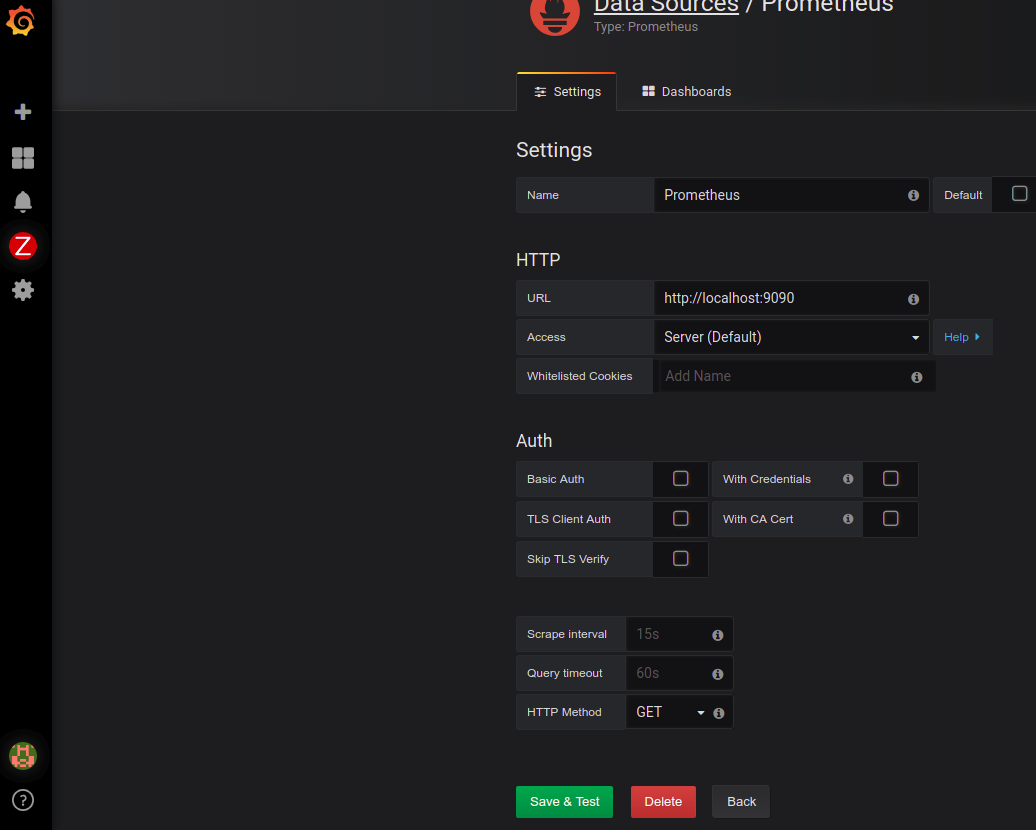
配置prometheus数据源
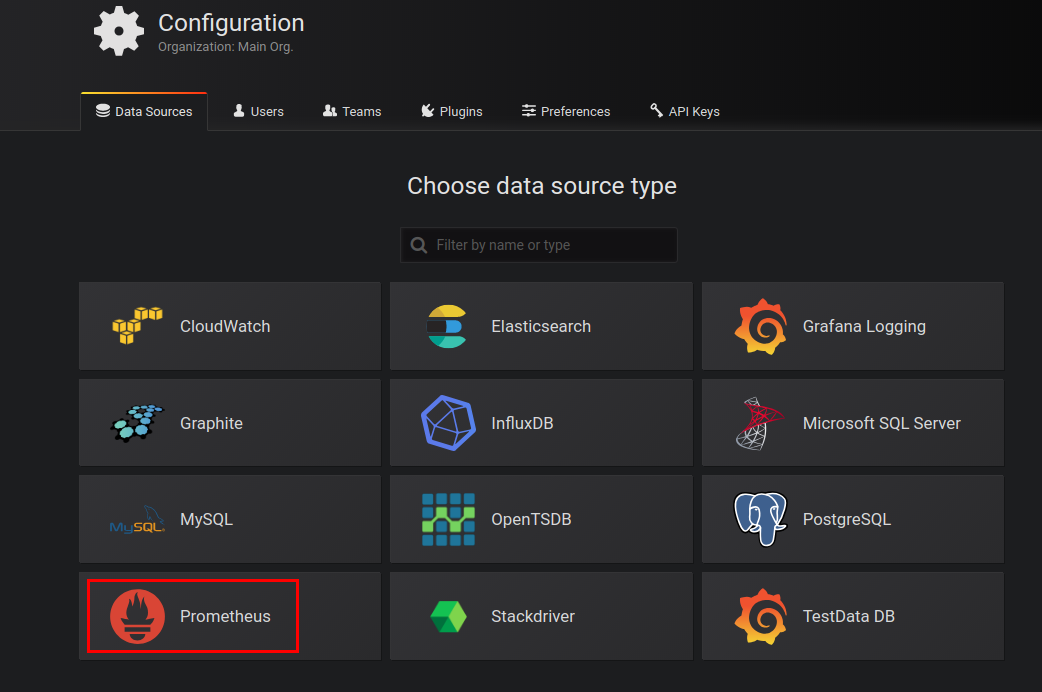
添加prometheus插件,然后配置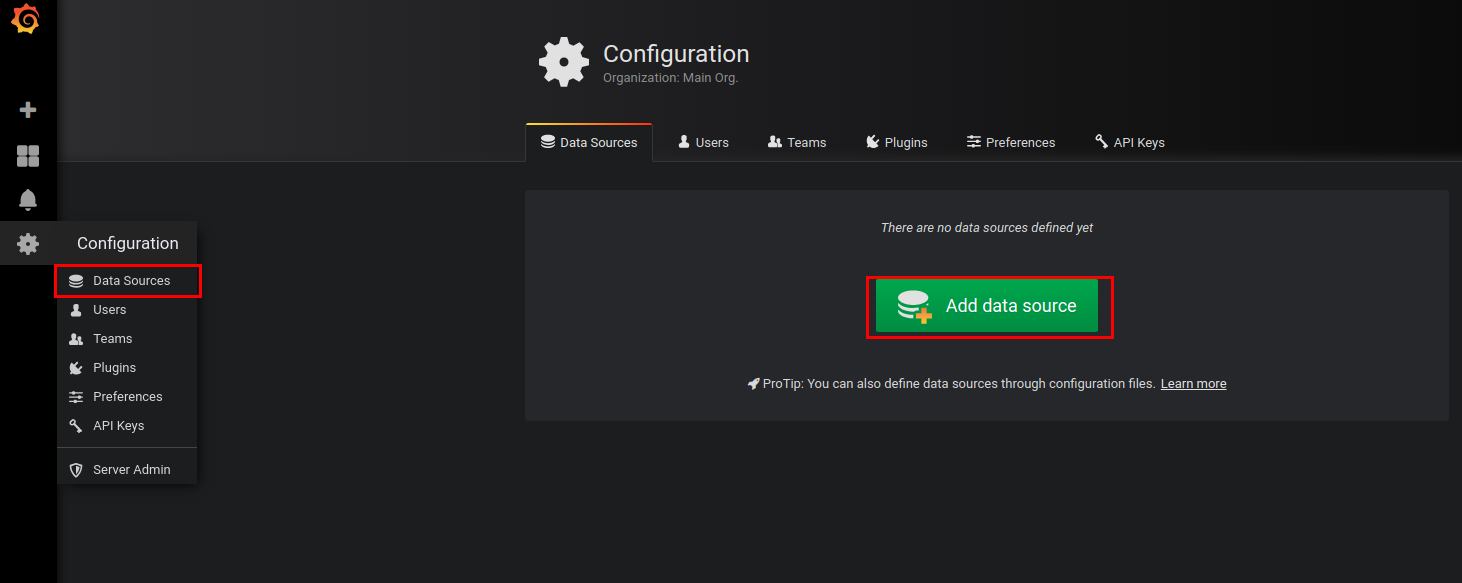
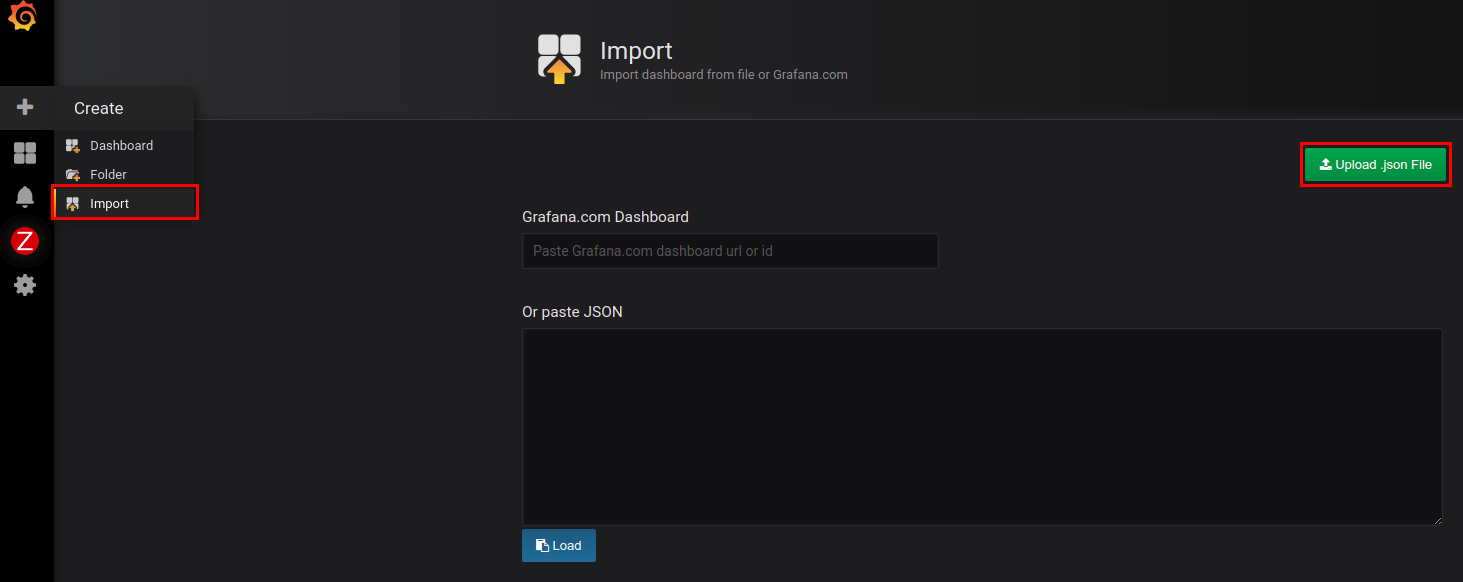
下载仪表盘模板
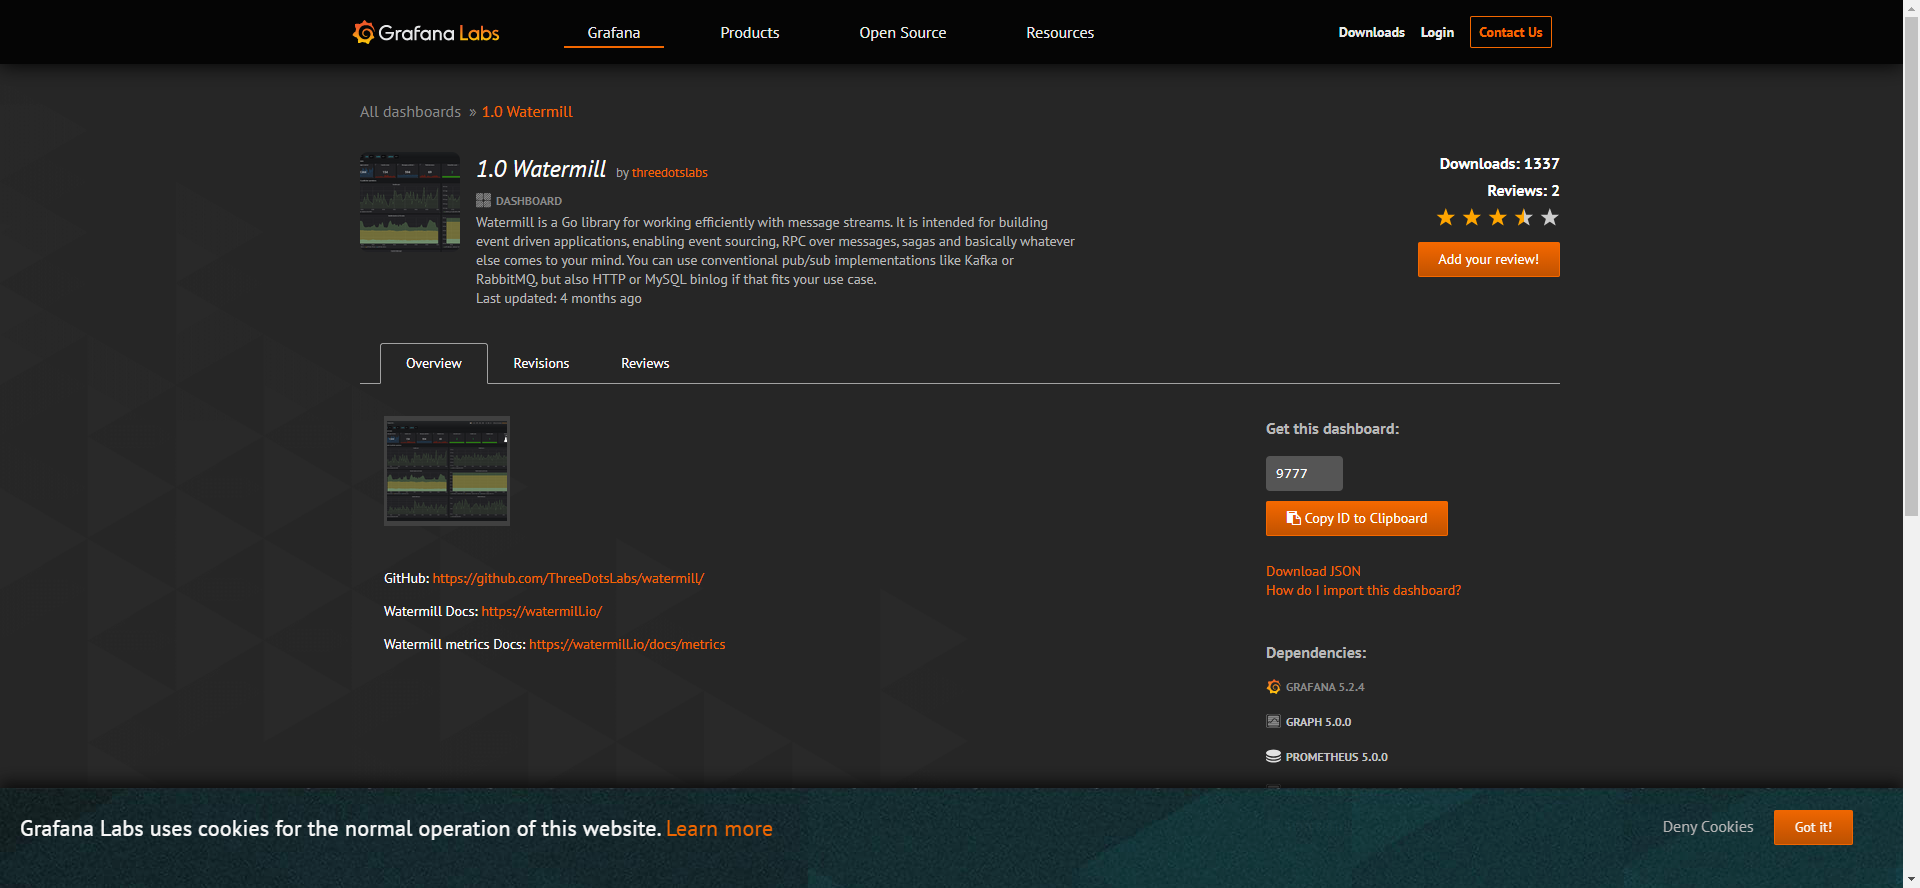
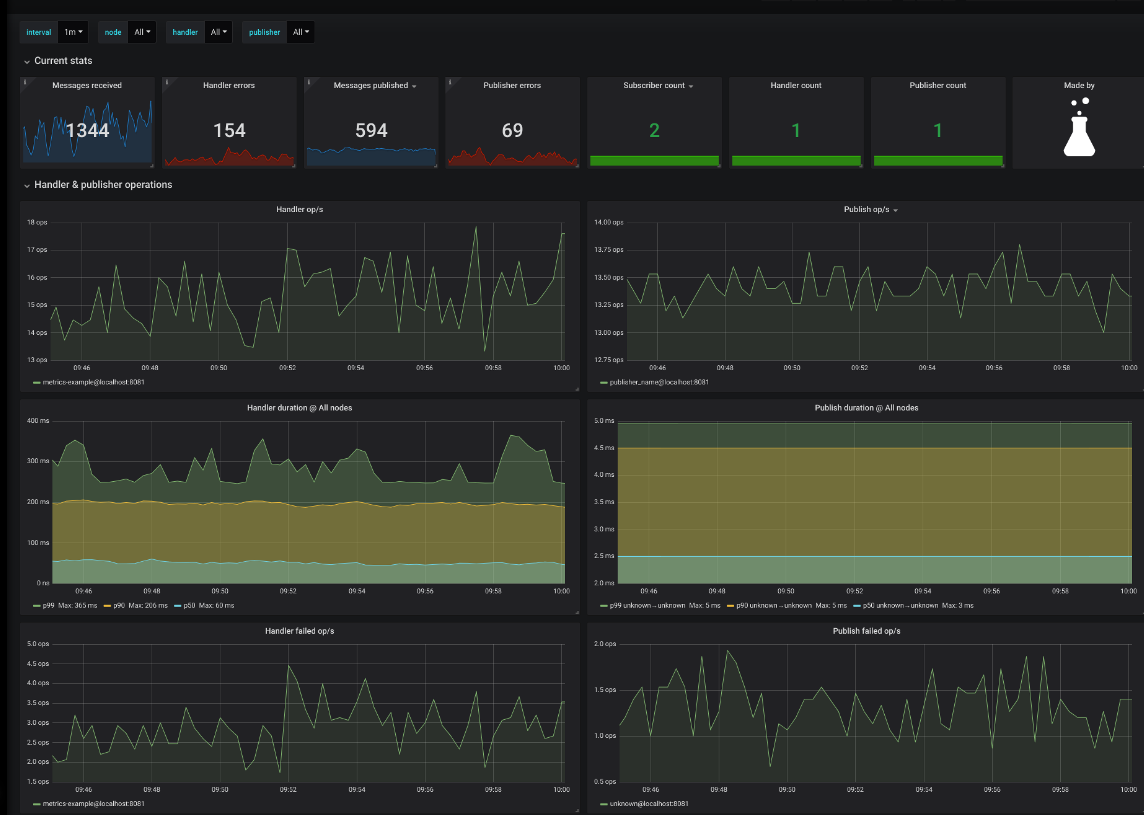
导入模板